LOLStats
Sept. 6, 2020If you play League of Legends, you've probably also heard of OP.GG. For those that don't know what League of Legends is, it's basically a massively popular 5v5 MOBA game in which two teams of 5 players brawl it out and try to destroy the other team's base (called the Nexus). OP.GG on the other hand is a website on which players can check their end game stats, view player match histories, and a whole bunch of other cool stuff.
1. OP Score
The Bane of My ExistenceDon't get me wrong, I love OP.GG, and personally, I use it a lot. However, one thing that always bothered me was OP.GG's "OP Score".
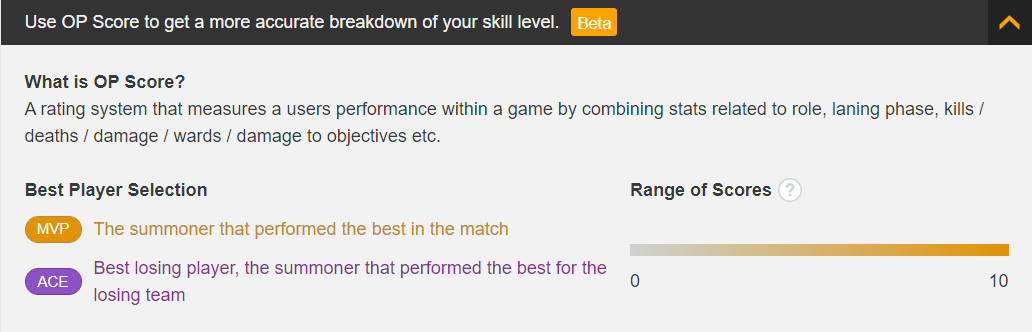
What's an "OP Score"? Well, according to OP.GG, it's
A rating system that measures a users performance within a game by combining stats related to role, laning phase, kills / deaths / damage / wards / damage to objectives etc.
What does this mean? Basically OP.GG looks at your game performance (kills, deaths, etc.) and rates your performance on a scale from 0 to 10, where 10 is great and 0 is, well, not so good.
What does this number really mean though? Basically nothing. At least, taken at face value, the only valid assumption we can make here is that a score of 9.8 is better than a score of 4.7, but not how much better. Just because one score is numerically more than twice the other score, this does not mean one score represents a player that's twice as good as the other.
2. Numbers Lie
"There are three kinds of lies: lies, damned lies, and statistics."It's not uncommon for graphs and statistics to be misleading. In fact, I'd go as far as to argue that unlike most of mathematics (in which conclusions can be unequivocally proved), statistics is more so an art of persuasion rather than a rigorous formula.
Consider the growing income gap in the U.S. for example. Would you report the mean or the median income if you wanted to convince others that U.S. citizens make a lot of money? What if instead you wanted to address the issue of poverty in the U.S.? Which statistic do you think is higher?

"But if statistics lie, then what makes LOLStats so special?"
I should probably note here that what I've said isn't all entirely true. Numbers don't really lie. They tell it exactly as it is. It's more so what isn't written in the numbers that deceive us. For example, the U.S. median income is lower than the mean income, and while both numbers accurately reflect some statistic about the income distribution, they lack to explain the skew and spread of the distributions. This lack of information right here is what creates the "lies".
With OP.GG, scores from 0 to 10 may (to some accurate extent) represent a player's skill and performance. However, what it lacks to tell us is how this metric scales. The wrong assumption that people may make here is that this 0 to 10 scale is linear, when in fact, it could be something entirely different. Hence, a score of 4.7 can't be said to be "twice" as worse as a score of 9.8
With all this said though, there's nothing really special about LOLStats other than its transparency on how it calculates scores as well as an interpretation of these scores. However, it's difficult to talk about LOLStats scores without describing how it works, so let's dive in.
3. Some Basic Probability Theory
How hard can this be?When it comes to defining an accurate and meaningful measure of a player's performance, we have to first define what performance is. Generically, we can define performance as the success of a task being carried out. In the context of League of Legends, we can say it's the success of carrying out the task of destroying the enemy's Nexus. Now, how can we measure this? Well, one way to do this would be to measure the rate of success (i.e. the win rate). So, with this in mind, let's see how we can measure win rate.
The most simple measure of win rate is just dividing the number of games won by the number of games played. However, this doesn't tell us a player's game performance. Rather, it tells us the player's overall performance. The difference here is that instead of thinking longitudinally along a player's match history, we should be thinking laterally across all games played.
Basically, given a player's actions in a game, we want to calculate how likely that player is to win across all possible games that could've been played. Mathematically, we can express this as a conditional probability:
$$ P(\text{win } | \text{ player actions}) $$
This allows us to measure how successful a player's actions are in achieving a win given their actions. Note that we do not factor into consideration a player's teammates' actions, nor the enemies'. The interpretation of this probability is basically "Out of all the possible teammates and opponents that a player could've had, what proportion of games should he/she have won given his actions." This way, one could argue that you can't really "blame" your teammates for feeding or carrying, because we're essentially considering all possible scenarios (both where your teammates feed or carry).
Now, what exactly is a player's action? Well, it's anything that a player does that involves a decision. This could be an item that he/she purchases (as opposed to another item or not purchasing anything at all). This could be an objective that he/she chooses to take down. There are tons of different moves that can be made in any game.
Let's take a look a some examples below.
4. Kills, Deaths, and Everything in Between
KDA Players amirite?Let's take a look at a simple statistic in the game: number of kills. So far, I've scanned over 300,000 games, and here are the results.
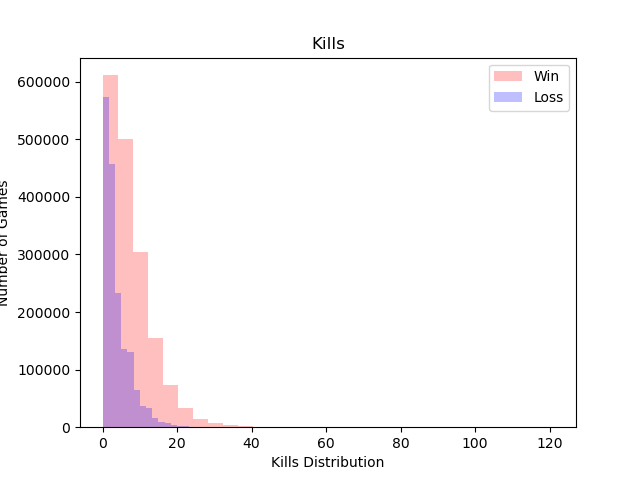
As one can see, as the number of kills increase, the proportion of wins increases. To better show this, we can graph the win rate of these bins as a function of the number of kills.
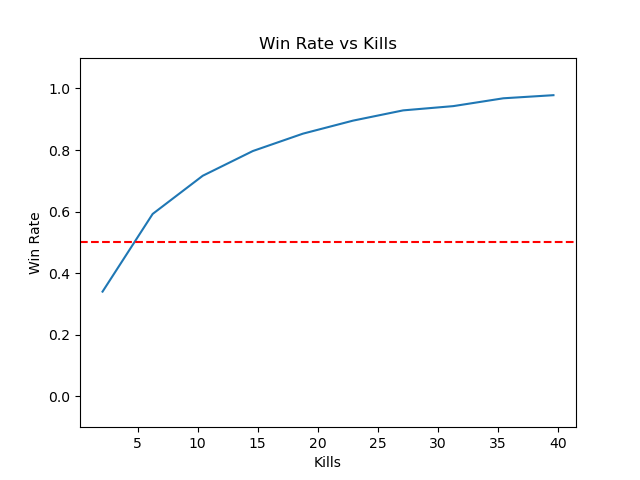
At around 5 kills, we can see that the odds of winning begin to turn in the player's favor.
"Well duh," most of you are probably thinking, "of course more kills mean a higher win rate." Yeah, yeah I get it. It takes no genius to figure out that killing your enemies will make it easier to destroy their base. However, we now have a measurement of success. For someone with 5 kills, we can say that their chances of winning is around 50%. For someone with 20+ kills (which rarely ever happens), we can say they're carrying the game on their shoulders (at basically a ~85% win rate).
Now don't worry, you support mains, we haven't forgotten about you guys. "Kills" isn't the only way that you can perform well (i.e. carry a game). The number of assists is another relevant statistic that can contribute to a win, and the graph above doesn't exactly put our support buddies in a good light.
Here's another plot that shows the tradeoff between number of kills and number of assists.
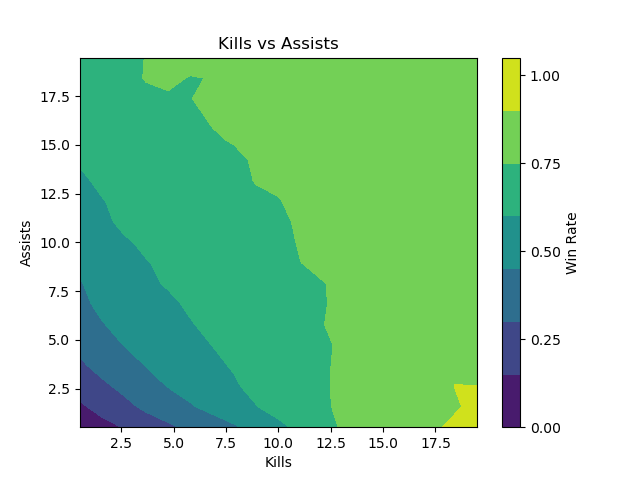
So sure, you can live in the bottom right corner of this graph with 20 kills per game and 0 assists. But there are other ways you can contribute. If you have 20+ assists with only a few kills, you'll still be chilling at a good 80% - 90% win rate.
Note, however, that having 20 kills is still better than having 20 assists. Maybe being a K/D player is better than a team player? I mean, a 20-kill Master Yi is pretty unstoppable.
What we can draw from this analysis is two things. First, we can see how analyzing some statistic like "number of kills" allows us to predict winning probabilities, which translates to performance by our definition. And secondly, we can see how analyzing multiple statistics like "number of kills" and "number of assists" can provide a more holistic picture. So, with this in mind, the next step is obvious: more data.
5. Adding More Data
Sometimes, more isn't lessNow, we saw above how looking at number of kills isn't enough. Support players, for example, are an entire class of players that win through assisting their teammates. Thus, we need to get more features. Riot Games features a set of API's that allow us to retrieve game data. There are many attributes, and as of Sept. 6th, 2020, LOLStats is using 49 post-match player features. The list is as follows:
- matchDuration
- kills
- deaths
- assists
- largestKillingSpree
- largestMultiKill
- killingSprees
- longestTimeSpentLiving
- doubleKills
- tripleKills
- quadraKills
- pentaKills
- unrealKills
- totalDamageDealt
- magicDamageDealt
- physicalDamageDealt
- trueDamageDealt
- largestCriticalStrike
- totalDamageDealtToChampions
- magicDamageDealtToChampions
- physicalDamageDealtToChampions
- trueDamageDealtToChampions
- totalHeal
- totalUnitsHealed
- damageSelfMitigated
- damageDealtToObjectives
- damageDealtToTurrets
- visionScore
- timeCCingOthers
- totalDamageTaken
- magicalDamageTaken
- physicalDamageTaken
- trueDamageTaken
- goldEarned
- goldSpent
- turretKills
- inhibitorKills
- totalMinionsKilled
- neutralMinionsKilled
- neutralMinionsKilledTeamJungle
- neutralMinionsKilledEnemyJungle
- totalTimeCrowdControlDealt
- champLevel
- visionWardsBoughtInGame
- wardsPlaced
- wardsKilled
- firstBloodKill
- firstBloodAssist
- lane
As you can see, this list is fairly comprehensive, and I'm pretty glad that Riot is offering all this data for free, for everyone. However, it's not complete (yet). There definitely are plans to add more features here, and more importantly, features that can cover a more fundamental level of performance such as player positioning and item choices. Unfortunately, the API (for good reason) doesn't reveal every single detail of each game, and I haven't (yet) coded all the infrastructure to handle things like player item choice either. However, this list is a good place to start.
Now, with 49 features (and more to come), it becomes difficult for us to generate pretty graphs like the ones shown on this website and calculate winning chances in this manner. More so, it becomes impossible to collect enough data such that we can calculate accurate win rates for every feasible possible combination of values for each of those features.
In fact, in preliminary testing, I experimented with several simple machine learning techniques. The first is logistic regression. The thing with logistic regression is that it's very simple to implement and quick to train. However, as the number of data points increased, the accuracy of logistic regression plateaued to a steady 89.6%. This is ~ok ish, but not that good. Later, I tried with several other ML methods ranging from nearest neighbor to radial kernel SVMs. However, I just couldn't break the 90% accuracy barrier. Intuitively, I felt that the dataset was too small to train a model with accurate predictions.
What we needed was something more powerful. Thus, I settled on a neural network.
6. Deep Learning
No, not SkynetWhen it comes to classification models, most people care about accuracy. However, we care about something related but slightly different. We care about minimizing the cross entropy between our model's learned distribution and the real distribution \(P(\text{win } | \text{ player actions})\).
$$ \text{Cross Entropy Loss} = \mathbf{E} [- y \log{\hat{y}} - (1 - y)\log{(1 - \hat{y})}] $$
This is because we care more than just predicting if a player's actions led to a win or not. We care about how likely a player's actions have led to a win because this system, afterall, is meant to rate performance (which isn't binary).
If we minimize the cross entropy loss, we can see that the optimal solution is exactly at \(\hat{y} = y\)
Now, with this in mind, we can train a model to learn
$$ P(\text{win } | \text{ \{matchDuration, kills, deaths, ...\}}) $$
And what this means is we can use the model to predict something like
$$ P(\text{win } | \text{ \{matchDuration = 1289 minutes, kills = 7, deaths = 3, ...\}}) $$
I'll skip the details of hyperparameter tuning, adding BatchNorms, experimenting with different Dropout rates, etc. The final accuracy of this neural network was 95%, which is more acceptable.
7. Coming Soon...
(June 3, 2022 update) Exciting stuff coming upThere are many shortcomings with the current approach. But don't fret! LOLStats 2 is getting a revival soon.
7. Putting It All Together
FinallyYou can check out LOLStats here. A Raspberry Pi currently serves the React app, and it communicates with my local desktop which serves the ML model. This combination is definitely not optimal, but for rapid prototyping, I went with this because it works and it's also very easy for me to train a new model and deploy it without downtime for the Raspberry Pi. The downside though is that I have to keep my local desktop running if I want LOLStats to work.
8. Whats Next?
The sky's the limitRight now, there are two major areas of improvement that I need to work on. First is the infrastructure stack, which looks pretty shabby. I mean, I'm hosting a website on a Raspberry Pi, which runs ML inferences on my computer. If any of those services go down, the entire website stops working (which is the main reason why it's in beta). The second issue is the ML itself. As I wrote above, the model is trained (as of now) only on post game data. There's definitely a lot more information to be exploited through in game data (which is coming soon!) as well as player match-ups.
Misc
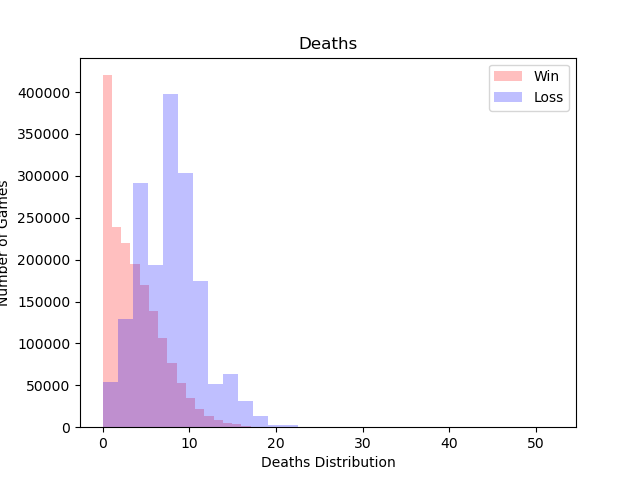
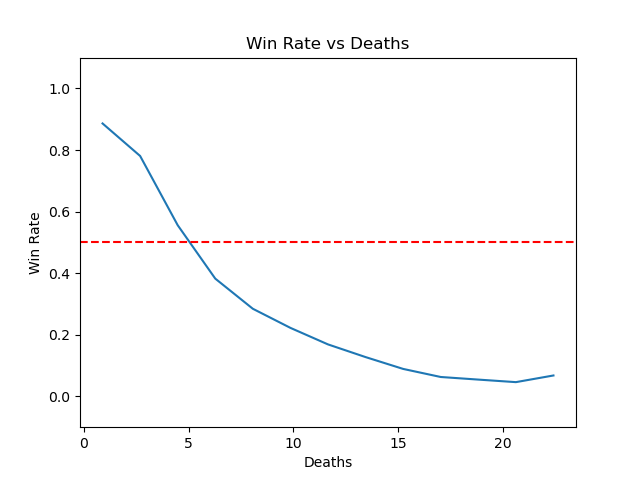
Some more colorful graphsHere's the death distribution of winning and losing games as well as win rate.
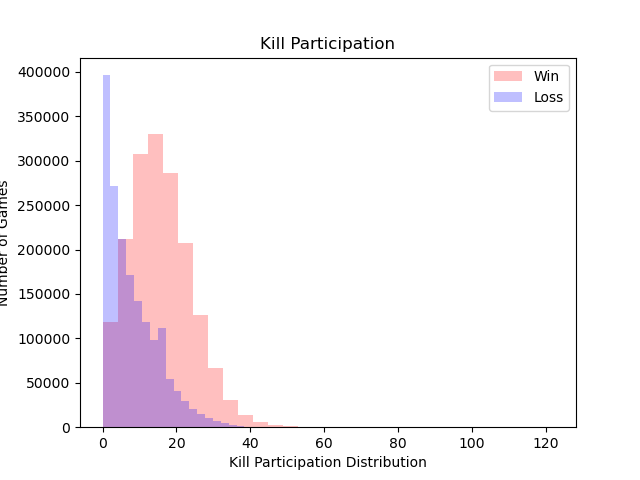
Here's the kill participation (kills + assists) distribution of winning and losing games as well as win rate.
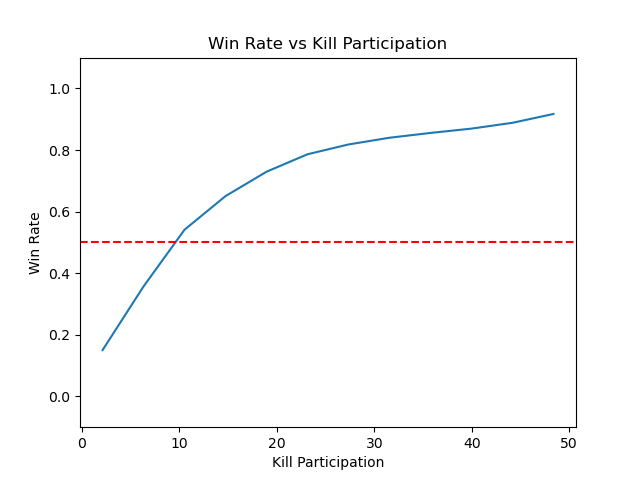
And here are similar graphs for vision score.
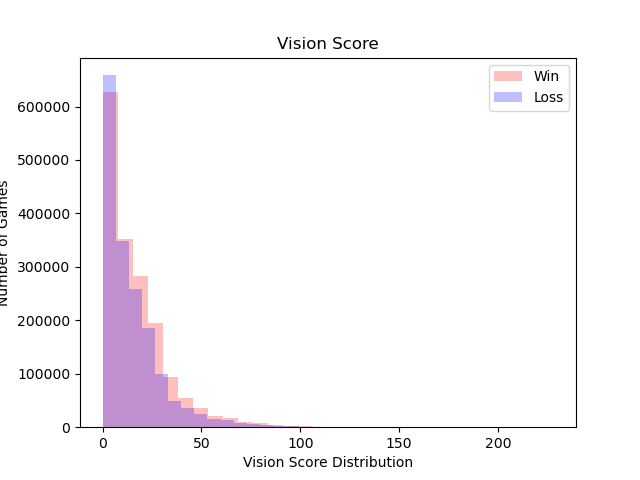
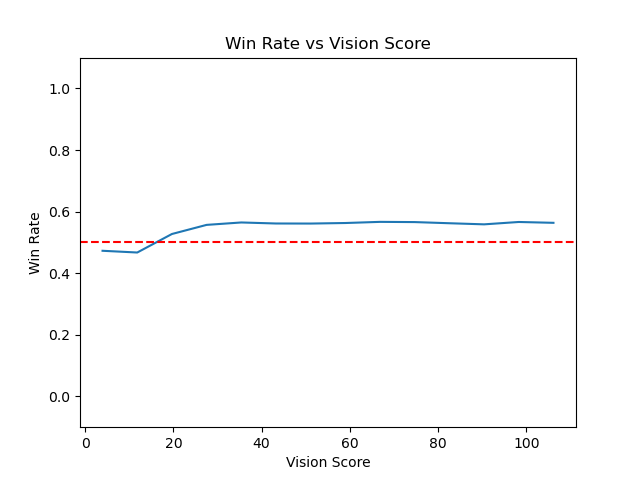
To be honest, I thought the win rate would go up higher with more wards, but I guess warding isn't *that* important.
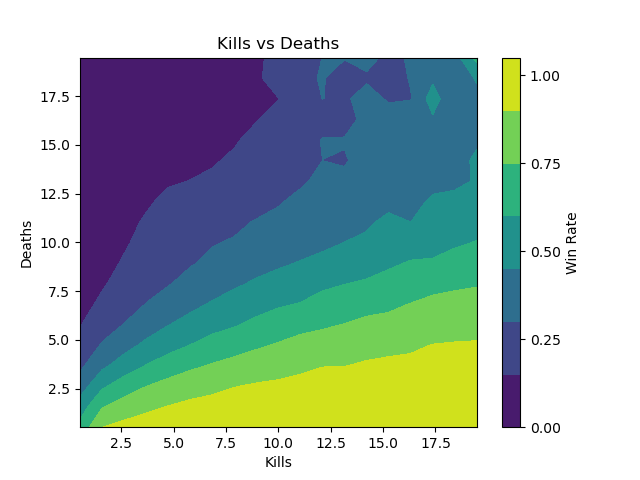
Finally, here's a plot for the kills vs deaths tradeoff. Something cool to note is that we can take the slopes of these region boundaries and see that players with a K/D ratio of 4 or greater will have a very high chance of winning.